An email with a link to the Log Checking Report has been sent to everyone who submitted a log for the CQ WW DX Contest CW 2013. The Log Checking Report includes a complete summary of how the final score was calculated and any errors or deductions that may have occurred. We make these reports available so participants can have the opportunity to learn from their mistakes.
How does your accuracy compare to others? The chart below shows the number of errors by percentage and the cumulative percentage of entrants in that bin.
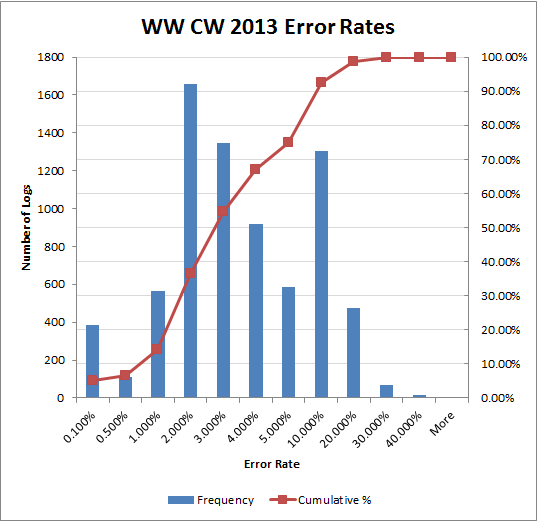
Table. Numeric values for chart
| Error Rate bin | Number of logs | Cumulative % |
| <0.100% | 386 | 5.19% |
| 0.500% | 113 | 6.71% |
| 1.000% | 565 | 14.30% |
| 2.000% | 1658 | 36.58% |
| 3.000% | 1347 | 54.68% |
| 4.000% | 921 | 67.05% |
| 5.000% | 584 | 74.90% |
| 10.000% | 1305 | 92.43% |
| 20.000% | 477 | 98.84% |
| 30.000% | 68 | 99.76% |
| 40.000% | 17 | 99.99% |
| More | 1 | 100.00% |
For example, there were 1658 logs with an error rate between 1.0 and 2.0%. 36.5% of the total entrants had an error rate of 2.0% or less. The median error rate was 2.7%. This is an amazingly good result when you consider the total number of contacts made during the contest.
A few more statistics from the contest log checking.
 7,442 logs total
5,505,384 QSO total
 205 different countries
 39,950 ( 0.7%) QSO with unique calls
 22,495 (56.3%) unique calls busted
 55,672 ( 1.0%) dupes
 323 ( 0.0%) Cabrillo format errors
4,871,227 (88.5%) QSO checked against another log
4,729,508 (97.1%) QSO checked good against another log
 73,087 ( 1.5%) busted calls
 22,165 ( 0.5%) busted exchange
 46,467 ( 1.0%) not in log
The scores in the LCR are what will appear in the official results. The results for CQ WW SSB and CW 2013 are scheduled to appear in the May 2014 issue of CQ Magazine.
Please send any questions or comments about your log checking report at: https://cqww.com/contact.