Last week, we looked at SSB High Power, SOAB. This time we do the same, but for SOAB Low Power.
The two tables below show all continental data for SOAB Low Power.
The graphic below shows only AS, EU, and NA because of the higher volume of entrants.
The trend is similar to what was found for High Power.
Next time, we’ll look at CW.
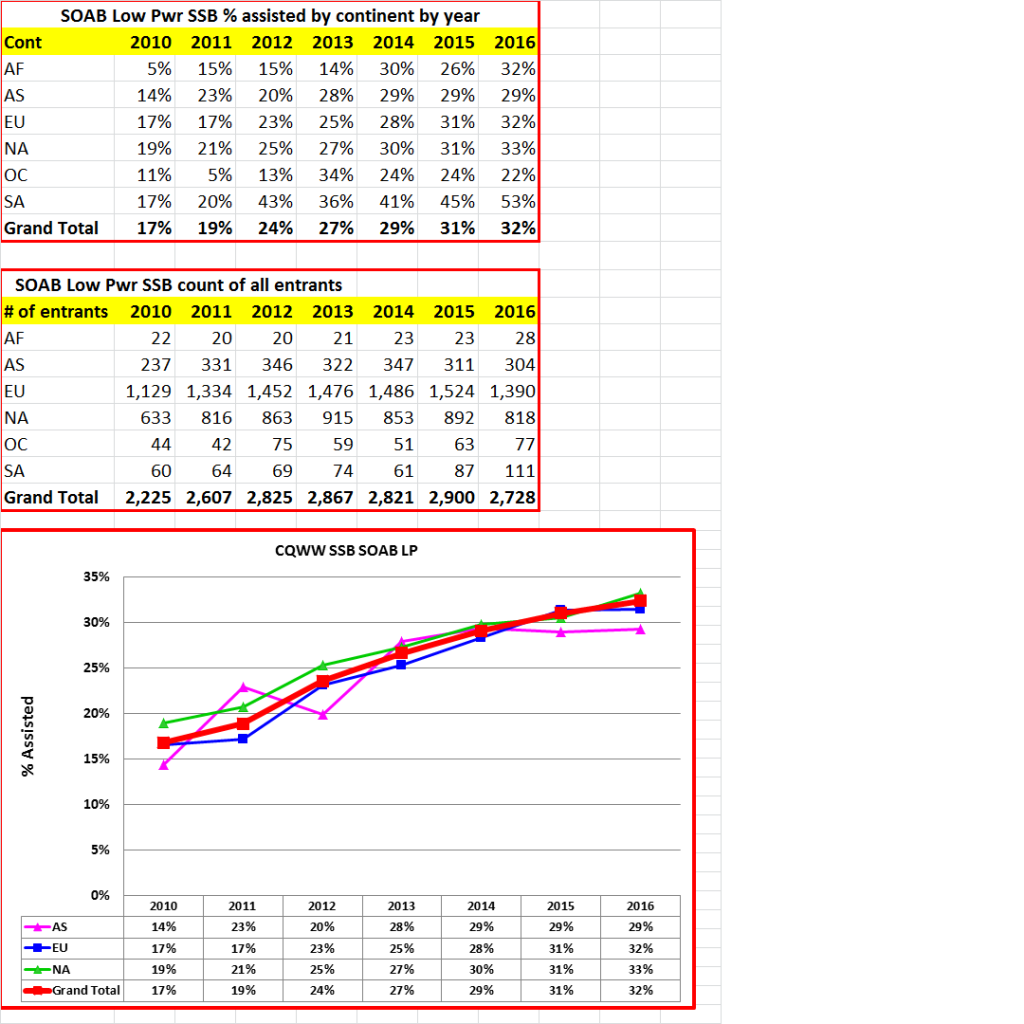
Please note the scale for the Y axis (above).