CQ WW CW 2013 Log Checking Reports

An email with a link to the Log Checking Report has been sent to everyone who submitted a log for the CQ WW DX Contest CW 2013. The Log Checking Report includes a complete summary of how the final score was calculated and any errors or deductions that may have occurred. We make these reports available so participants can have the opportunity to learn from their mistakes.

How does your accuracy compare to others? The chart below shows the number of errors by percentage and the cumulative percentage of entrants in that bin.


WW CW 2013 Error Rates Chart


Table. Numeric values for chart

Error Rate bin Number of logs Cumulative %
<0.100% 386 5.19%
0.500% 113 6.71%
1.000% 565 14.30%
2.000% 1658 36.58%
3.000% 1347 54.68%
4.000% 921 67.05%
5.000% 584 74.90%
10.000% 1305 92.43%
20.000% 477 98.84%
30.000% 68 99.76%
40.000% 17 99.99%
More 1 100.00%

For example, there were 1658 logs with an error rate between 1.0 and 2.0%. 36.5% of the total entrants had an error rate of 2.0% or less. The median error rate was 2.7%. This is an amazingly good result when you consider the total number of contacts made during the contest.

A few more statistics from the contest log checking.

 7,442 logs total
5,505,384 QSO total
 205 different countries
 39,950 ( 0.7%) QSO with unique calls
 22,495 (56.3%) unique calls busted 
 55,672 ( 1.0%) dupes
 323 ( 0.0%) Cabrillo format errors
4,871,227 (88.5%) QSO checked against another log
4,729,508 (97.1%) QSO checked good against another log
 73,087 ( 1.5%) busted calls
 22,165 ( 0.5%) busted exchange
 46,467 ( 1.0%) not in log

The scores in the LCR are what will appear in the official results. The results for CQ WW SSB and CW 2013 are scheduled to appear in the May 2014 issue of CQ Magazine.

Please send any questions or comments about your log checking report  at: https://cqww.com/contact.

How fast do people send in WW CW?

Bob Wilson N6TV did some analysis using new columns in the raw data archived by the Reverse Beacon Network.

We finally have an answer to that age old question, “So, how fast do people send Morse code in CQ WW CW?”

Answer:  about 30 WPM

Shown below is the average CW speed of all the RBN spots, by continent (of the DX).
Those African DXpeditioners really know how to QRQ (especially EF8U).  And yes, most slow down a bit on Sunday, even if conditions improve:
           2013 CQ WW CW, Saturday
        ——– Speed (WPM) ——-
Cont    Max    Min      Avg   StdDev       Spots
  AF     53      8     34.0      4.3       61707
  AS     47      5     30.8      4.1      229914
  EU     53      2     31.1      3.6     1578113
  NA     51      1     31.1      3.8      772140
  OC     40      7     30.2      3.6       29966
  SA     49      4     31.8      4.2      124923
—-     —     —     —-     —-     ——-
 Tot     53      1     31.2      3.8     2796763
 
           2013 CQ WW CW, Sunday
        ——– Speed (WPM) ——-
Cont    Max    Min      Avg   StdDev       Spots
  AF     50      6     32.9      4.3       66334
  AS     47      2     30.2      3.8      227485
  EU     51      2     30.2      3.5     1607793
  NA     51      2     29.9      3.6      843113
  OC     41      5     29.7      3.3       31278
  SA     47      6     31.4      3.8      137572
—-     —     —     —-     —-     ——-
 Tot     51      2     30.2      3.6     2913575


Do people send slower on the low bands?  Yes, the lower the band, the slower they go.

  2013 CQ WW CW, Saturday
        ——– Speed (WPM) ——-
Band    Max    Min      Avg   StdDev       Spots
 10m     53      5     31.8      4.0      341152
 15m     53      4     31.7      3.7      505217
 20m     51      1     31.6      3.7      574727
 40m     53      1     31.1      3.7      868980
 80m     51      2     30.1      3.5      403785
160m     43      2     28.3      3.5      102902
—-     —     —     —-     —-     ——-
 Tot     53      1     31.2      3.8     2796763
 
           2013 CQ WW CW, Sunday
        ——– Speed (WPM) ——-
Band    Max    Min      Avg   StdDev       Spots
 10m     49      4     30.9      3.9      278449
 15m     50      3     31.0      3.7      484538
 20m     51      2     30.8      3.5      694123
 40m     49      3     30.0      3.4      888032
 80m     46      2     29.4      3.3      443191
160m     47      4     27.3      3.3      125242
—-     —     —     —-     —-     ——-
 Tot     51      2     30.2      3.6     2913575


Map showing typical RBN data

The RBN collects data from receivers around the world and stores it into a database. These reports include call, frequency, signal-to-noise ratio, and CW speed. More information about the Reverse Beacon Network is available at http://www.reversebeacon.net/

Thanks to N6TV for sharing his analysis.

CQ WW SSB 2013 Log Checking Reports

Everyone who submitted a log for the CQ WW DX Contest SSB 2013 has been mailed an encrypted link to view their Log Checking Report for the contest. The reports were sent to the email address that submitted the log and to any email address included within the log (using the EMAIL tag).  If you have not received your report, please check your spam filters. You can request the link at: https://cqww.com/contact.

You can view a sample Log Checking Report here: k5zd.rpt

Some statistics from the log checking process:

8,482 logs total
5,551,137 qso total
 228 different countries
 58,328 ( 1.1%) qso with unique calls
 29,914 (51.3%) unique calls busted 
 45,380 ( 0.8%) dupes
 443 ( 0.0%) Cabrillo format errors
4,547,210 (81.9%) qso checked against another log
4,416,925 (97.1%) qso checked good against another log
 73,173 ( 1.6%) busted calls
 19,108 ( 0.4%) busted exchange
 38,004 ( 0.8%) not in log

It is rather remarkable that almost 82% of the 5 million contacts reported were able to be cross checked with other logs. Thanks to everyone who submitted a log and helped make this level of cross checking possible. Even more amazing is that 97.1% of those contacts cross checked as being good.

The log checking report provides full details on how the final score for each entry was calculated.  It shows the raw score before checking and the reductions. Each Not-In-Log, busted callsign, and busted exchange are listed.

Unique QSOs are also listed for information purposes.  A unique QSO is one with a callsign that was not reported by any other station.  Over half (51.3%) of these were found to be busted calls.  But, experience says these unique QSOs are probably bad calls more than 90% of the time.

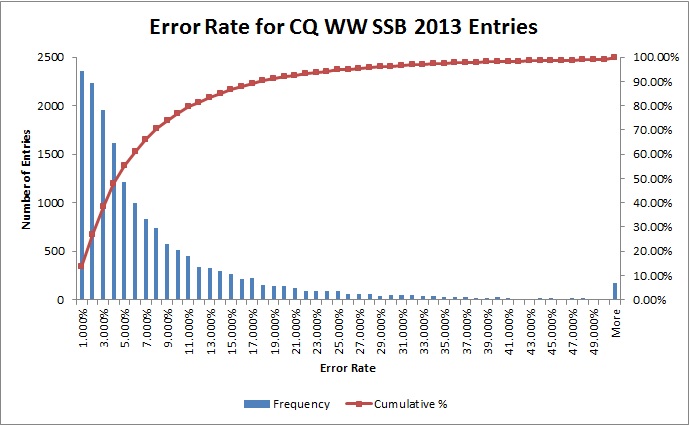
We have introduced a new Error Rate calculation to the reports this year. This number represents the percentage of contacts that were found to be in error. It does not include duplicate QSOs. This number is a more accurate representation of accuracy than looking at the percent score reduction, which can be much higher for smaller logs where the penalties and lost multipliers can have a higher impact than they do for large logs.

You can see the Error Rate number as part of the score summary section.

    1.3% Score reduction
    0.3% Error Rate based on claimed and final qso counts
       5 (0.2%) calls copied incorrectly
       0 (0.0%) exchanges copied incorrectly
       0 (0.0%) band change violations
       6 (0.2%) not in log
      15 (0.5%) duplicates (Removed without penalty)
       1 (0.0%) calls unique to this log only (not removed)

The average Error Rate for all logs was 3.60%. Use the chart below to see how your error rate compares to others. The blue lines show the number of logs with that error rate. The red line shows the cumulative number of logs at that error rate or lower. Someone with a 9% error rate was in the top 73% of all entries.

wwph13_error rate chart


Error Rate Count Cumulative % of all entries
<1.0% 2360 13.91%
2.0% 2237 27.10%
3.0% 1952 38.61%
4.0% 1614 48.12%
5.0% 1218 55.30%
6.0% 998 61.18%
7.0% 830 66.08%
8.0% 735 70.41%
9.0% 575 73.80%
10.0% 515 76.83%
11.0% 446 79.46%
12.0% 340 81.47%
13.0% 325 83.38%
14.0% 295 85.12%
15.0% 263 86.67%
16.0% 211 87.92%
17.0% 229 89.27%
18.0% 157 90.19%
19.0% 147 91.06%
20.0% 138 91.87%
21.0% 118 92.57%
22.0% 87 93.08%
23.0% 91 93.62%
24.0% 89 94.14%
25.0% 93 94.69%
26.0% 55 95.01%
27.0% 55 95.34%
28.0% 58 95.68%
29.0% 43 95.93%
30.0% 48 96.22%
31.0% 47 96.49%
32.0% 47 96.77%
33.0% 43 97.02%
34.0% 38 97.25%
35.0% 32 97.44%
36.0% 27 97.59%
37.0% 28 97.76%
38.0% 19 97.87%
39.0% 20 97.99%
40.0% 28 98.15%
41.0% 19 98.27%
42.0% 10 98.33%
43.0% 13 98.40%
44.0% 19 98.51%
45.0% 19 98.63%
46.0% 11 98.69%
47.0% 15 98.78%
48.0% 15 98.87%
49.0% 11 98.93%
50.0% 10 98.99%
>50.0% 171 100.00%

Please send any questions or comments at: https://cqww.com/contact.